Sunday, October 11, 2026
Home Blog Page 1467

What will happen to the BP building in a post-BP era?

1

By BRANDON SPOERHASE
GUEST CONTRIBUTOR

BP operations in Alaska date back more than 60 years. The company has had significant investments on the North Slope, specifically Prudhoe Bay, and almost half ownership in the trans-Alaska pipeline. Now, we know they are on their way out, selling their remaining Alaska assets to relative newcomer Hilcorp, a privately owned company.

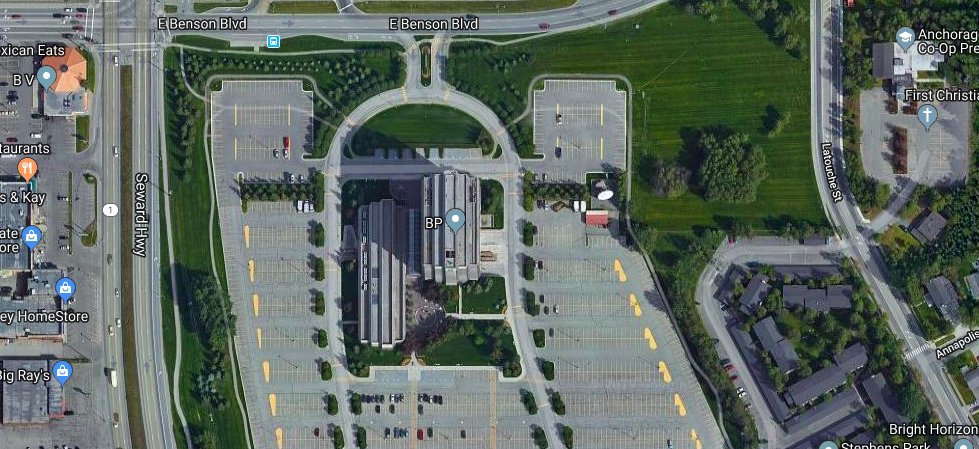
All BP’s Alaska operations and upstream business are headquartered at its iconic Anchorage office building on the corner of Benson Boulevard and the Seward Highway; you can see its unique yellow and green helio lit up on the side of the building for miles around. While the company has been selling some assets to other producers since at least 2015, the news of its departure poses big questions.

Brandon Spoerhase

What does BP’s departure mean for the commercial real estate market? First, some history.

BP’s Anchorage headquarters is a 15-floor, 324,000-square foot, Class A office building. It was built from 1983 to 1985, and the entire campus is 18 acres and includes a cafeteria and atrium. It is one of the most recognizable buildings in Alaska. (The company also built and operates the BP Energy Center, a building in midtown where nonprofit groups can meet for free. The Energy Center is the only Alaska asset not included in the sale to Hilcorp and BP has said it will remain in Anchorage “as a legacy.”)

The first phase of development was as an office building, with enough land to be able to accommodate a second tower if Alaska’s operations required one. In addition, it was designed to be able to convert to into a hotel when and if the time came for such a transition.

A few years ago, BP’s Anchorage property was sold to Oak Street Real Estate Capital, LLC, a private equity real estate firm based in Chicago, Illinois. The firm manages accounts for institutional and high net-worth investors, including public and corporate pension plans, insurance companies and trusts.

In Anchorage, the office Class A market vacancy rate was 15% in January. The market has continued to soften due to state budget concerns, with companies contracting and minimizing their occupancy costs. In the midst of this, BP attracted a new tenant to its building — Oil Search. This rapidly growing oil company relocated to this building from downtown, and has announced plans to ramp up with more employees in Alaska as it develops the exciting new Pikka development.

It is unknown what BP will do with its existing work force, although we can reasonably assume that some employees will be retained, some will move to other BP locations, and some will be laid off and potentially picked up by other oil and gas companies.

The other unknown is what BP will do with the remainder of the lease space and the remaining committed lease term as it prepares to transition out of Alaska. The continued softening of rental rates and rising vacancy rates has been the trend in 2019, and the Anchorage office market is going to feel the impact if BP’s current occupied space is vacated and available for lease. If Hilcorp moves into the BP building, the immediate impact will be lessened, though questions about how long they plan to stay there remain.

In the end, from a commercial real estate perspective, more questions are being asked than answered right now. It serves as a vivid reminder that change is the only constant in Alaska, whether in politics, the economy, or real estate. These types of events can be unsettling, but also present new opportunities. Office space owners and renters would be wise to take advantage of them.

Brandon Spoerhase is a lifelong Alaskan, a broker for BSI Commercial Real Estate, and a former member of the Anchorage Planning and Zoning Commission. He specializes in commercial and investment real estate. His column runs monthly in the Anchorage Daily News and is offered here with his permission.


Fitch does the downgrade on Alaska

23

HONG KONG ALSO DROPS A NOTCH

Fitch Ratings downgraded Alaska’s general obligation bond rating from AA to AA1 on Thursday, as it warned it would do months earlier if spending continued to exceed revenue.

The message from Fitch is that the State doesn’t have its fiscal house in order. The Legislature has continued since 2013 to appropriate more than the revenues can support, digging deeper and deeper into savings accounts.  Political realities prevented this governor, and the previous one, from cutting spending as much as needed to avoid a downgrade.

Gov. Bill Walker, before leaving office, added hundreds of millions of dollars to the state budget before pronouncing it “balanced.” It was up to Gov. Michael Dunleavy to bring a dose of courage needed to make the cuts.

Fitch and other ratings agencies don’t much care if Alaska cuts its budget or raises taxes; it just wants to see the books balance.

House Bill 2001, the operating budget that included  $156 million in budget restorations, reduced one third of the state’s deficit with a reduction of $650 million in total state spending. But it came at a political price that was born primarily by the governor, not by the bipartisan Legislature — he’s now the focus of a recall campaign led by Democrats.

On the bright side, Fitch said the State’s rating outlook is stable. In 2017, it said the outlook was unstable.

The AA+/Aa1 rating signifies that the issuer or carrier has strong financial backing and cash reserves, according to Investopedia. But it means it will cost the State more to borrow money for general obligation bond projects.

SAME RATING DOWNGRADE AS HONG KONG

Like Alaska, Hong Kong suffered the same rating fate, as it was downgraded by Fitch last week from AA+ to AA.

“Ongoing events have inflicted long-lasting damage to international perceptions of the quality and effectiveness of Hong Kong’s governance system and rule of law, and have called into question the stability and dynamism of its business environment. These features are integral to Fitch’s assessment of the territory’s creditworthiness, and while still strong in a global context, are at risk of being further eroded as a result of enduring social strife,” the agency said.

Did PBS find cause of Alaska students’ poor test scores? Climate change?

HOT WEATHER MAKING USA STUPIDER

If we’re to believe PBS science reporting, then climate change may be to blame for Alaska’s students performing worse than ever.

That would explain then why, with the Arctic warming at twice the rate of the rest of the planet, Alaska’s students have fallen further behind in their scoring on the standardized PEAKS test they took last spring.

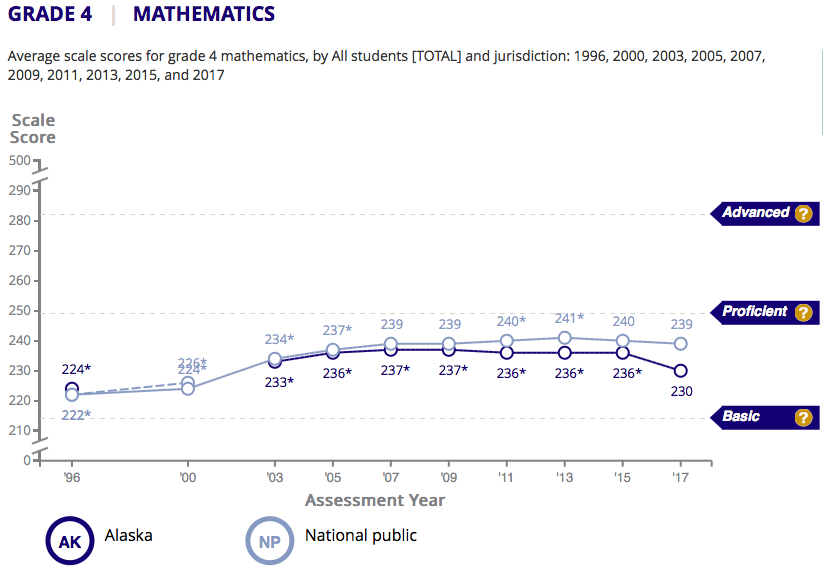
Students in Alaska did no better on the National Assessment of Educational Progress in 2017. Only 32 percent of students in Alaska performed at or above the national NAEP Proficient level in math.


[See more about Alaska’s NAEP math trends here]

PBS’s science headline reports, “The hotter the planet grows, the less children are learning.” They’ve got science to prove it, as well as anecdotal evidence from a teacher or two.

Of course, it makes sense. Everyone feels more sluggish when the temperatures soar, which is why offices are kept at a more ideal temperature range of 68-74 degrees.

But a Cornell Study showed that 77-degree offices actually reduced errors and are better for business.

What’s an eager science believer to believe?

PBS reports that for every 1 degree Fahrenheit increase in outdoor temperature over a year, there’s a 1 percent reduction in student learning.

Denver High School French teacher Tiffany Choi says the current heat wave in Denver is making the students sleepy.

“Today was a little bit hot, so I noticed kids were very sleepy and they were having to get up to drink water quite often. If you are dehydrated, and you have to keep going to the water fountain, that can take away from their classroom experience,” Choi told the reporter.

The heat wave in Colorado led to the following PBS reportage:

“The connection between lost learning and a greater number of hot days is one more example of how climate change is already affecting our lives — and it’s an alarm bell for what we stand to lose in the future. Humans still have time to allay the worst consequences of continued global warming. But unless significant changes occur in the next decade — which seem more and more unlikely — the world will be locked into an inescapable period of heat waves unlike our species has ever seen.”

The report cited further proof: “Hotter Southern counties — like in Florida and Texas — showed lower test scores than counties in the North, even after controlling for other socioeconomic factors like family income, county economic status or local pollution.”

“Aside from glimpsing what this limbo period will be mean for young students and their ability to learn, the study adds to hefty debate around how developed nations will be influenced by global warming. The prominent theory is low-income countries will bear the brunt of consequences, but this study and others point toward nuanced calamities for places like the U.S.,” says the PBS report.

In other spurious correlation news, Great Alaska Schools, the organization that advocates for more money for schools, last year blamed funding for the low test scores:

“I think that (the numbers) tell us that our schools are struggling to keep up with the low funding that they’ve received from the Legislature over the past few years,” Aaron Poe of Great Alaska Schools told a reporter. “There really have been some pretty significant cuts over the past few years and I think we’re starting to see some of that now with these low test scores.”

[Read: Are Alaska’s schools and educational desert?]

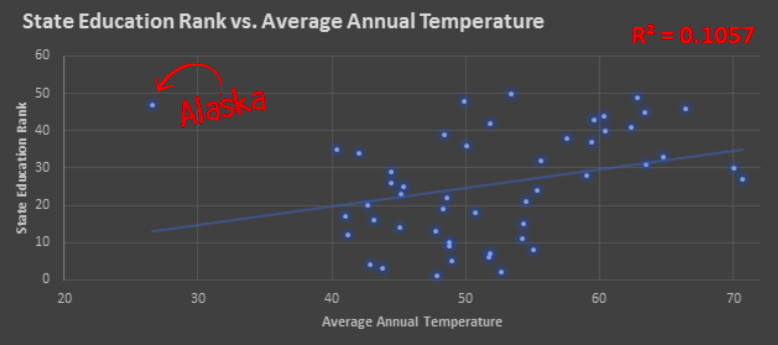
Must Read Alaska’s crack research team ran the numbers on state education rankings and temperature and found that Alaska, with the lowest average temperatures in the United States also ranks 47th out of 50 for education achievement, according to U.S. News and World Report:

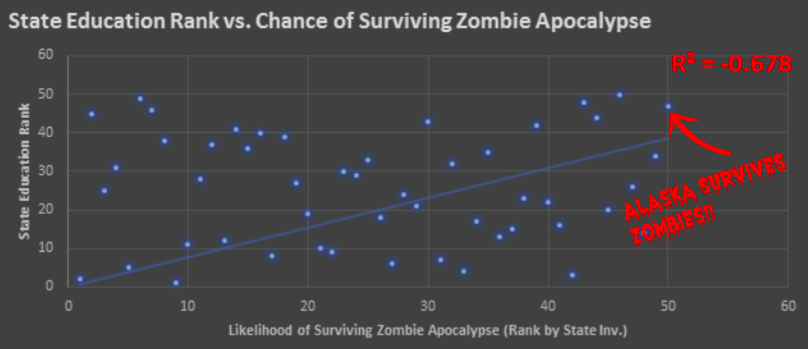
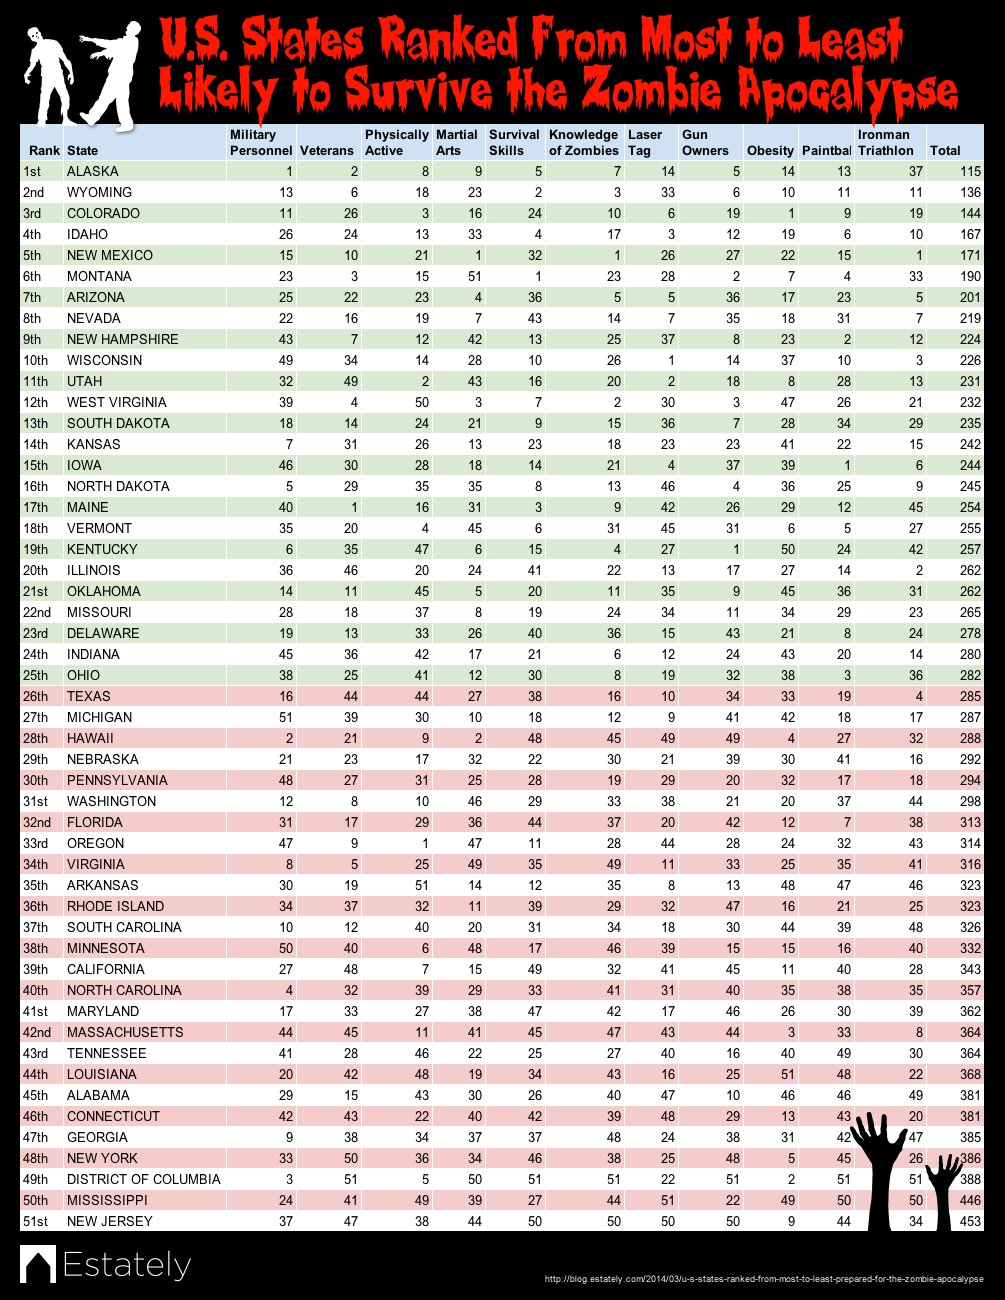
While on the other hand, Alaska, with its low educational ranking, would do well in a Zombie Apocalypse, according to our research team, which provided this stunning analysis:

Listicle: How Alaska healthcare costs compare with other states

13

People living in Alaska spend the most on healthcare in the country, and more than double what people in Hawaii spend, according a report on the website  The Senior List.

Using data from the Healthcare Cost Institute the study tells Alaskans who are on private insurance what they already know too well: The cost of medical care in the 49th state can be budget crushing.

Here’s how the 50 states and D.C. compare for health care spending:

1. Alaska – $7,469
2. West Virginia – $6,813
3. South Dakota – $6,733
4. New Hampshire – $6,720
5. Wyoming – $6,695
6. New Jersey – $6,402
7. Wisconsin – $6,355
8. New York – $6,335
9. South Carolina – $6,233
10. Connecticut – $6,232
11. North Dakota – $6,131
12. Vermont – $6,103
13 Texas – $6,057
14. Indiana – $6,043
15. Maine – $5,993
16. Minnesota – $5,988
17. Ohio – $5,975
18. Delaware – $5,805
19. Nebraska – $5,772
20. Pennsylvania – $5,696
21. Georgia – $5,668
22. Florida – $5,615
23. Louisiana – $5,577
24. Kentucky – $5,566
25. North Carolina – $5,532
26. Rhode Island – $5,508
27. Washington, D.C. – $5,488
28. Colorado – $5,487
29. Illinois – $5,478
30. California – $5,466
31. Idaho – $5,458
32. Virginia – $5,455
33. Oklahoma – $5,427
34. Massachusetts – $5,426
35. New Mexico – $5,408
36. Mississippi – $5,385
37. Iowa – $5,364
38. Washington – $5,348
39. Montana – $5,336
40. Tennessee – $5.306
41. Missouri – $5,184
42. Oregon – $5,112
43. Alabama – $5,031
44. Nevada – $5,028
45. Arizona – $4,962
46. Michigan – $4,961
47. Maryland – $4,919
48. Kansas – $4,887
49. Arkansas – $4,608
50. Utah – $4,499
51. Hawaii – $3,626

From the Healthcare Cost Institute, a breakdown of average prices for common services shows what those services cost in 2013 through 2017 in every state and D.C. (this table is not particularly readable on a smart phone.) The 2017 Health Care Cost and Utilization Report shows that spending per privately insured person grew by 4.2 percent, the second year in a row of spending growth over four percent. Price increases were the primary driver. The report covers the period 2013 through 2017 and includes claims data from four national insurance companies: Aetna, Humana, Kaiser Permanente, and UnitedHealthcare.​ 

Download the data files here.

Annual Average Price by State by Service Category
Inpatient Outpatient Professional Services Prescription Drugs
State 2013 2014 2015 2016 2017 2013 2014 2015 2016 2017 2013 2014 2015 2016 2017 2013 2014 2015 2016 2017
AK 22,959.98 26,428.35 30,499.98 33,385.15 31,319.86 685.27 652.24 699.91 739.22 732.18 214.7 213.83 228.57 236.42 238.66 86.31 101.78 112.06 116.9 112.83
AL 13,317.90 14,701.49 14,961.42 16,675.18 16,206.03 394.95 416.3 423.8 433.72 459.44 84.67 85.93 86.99 93.76 95.56 76.94 80.53 85.85 93.33 96.5
AR 12,218.49 12,811.20 13,478.52 14,414.34 14,996.46 361.54 377.18 376.5 383.98 396.64 85.07 86.59 90.55 93.98 95.7 71.96 78.66 84.37 92.04 94.59
AZ 15,627.47 15,583.64 17,130.65 18,303.41 19,013.65 613.98 674.5 683.41 715.37 769.22 89.04 90.86 92.67 101.36 106.05 86.59 92.2 99.33 104.41 106.43
CA 26,316.75 27,314.91 28,826.98 30,345.91 32,010.27 711.8 782.82 818.03 838.9 892.7 99.24 103.37 106.43 111.68 118.61 74.79 80.56 89.59 92.9 91.78
CO 18,528.69 19,187.43 20,639.93 20,857.25 22,121.56 635.14 661.89 682 698.08 738.5 100.14 103.12 107.21 113.04 117.81 93.8 99.34 107.02 112.94 113.67
CT 17,265.71 18,583.23 19,686.15 21,022.89 22,306.06 328.4 352.43 373.04 379.84 406.39 113.03 115.93 120.34 125.16 130.64 102.59 111.39 121.16 127.48 129.38
DC 14,681.01 14,604.64 18,325.86 16,653.51 18,347.22 528.26 569.59 566.78 584.7 615.81 92.45 96.22 99.91 104.7 105.21 116.99 131.62 150.26 162.36 171.34
DE 18,912.75 18,903.41 21,917.02 23,402.56 21,783.13 564.01 602.74 613.44 648.17 605.08 94.68 96.64 100.01 105.26 109.28 92.82 100.58 110.95 108.23 113.13
FL 16,326.69 17,210.71 18,128.91 19,210.90 20,230.51 594.68 633.91 673.17 699.89 743 91.89 94.96 99.21 104.24 108.94 98.61 104.38 111.44 113.71 112.87
GA 15,414.04 16,135.84 16,661.19 18,249.91 19,173.94 557.02 605.74 641.92 670.64 698.68 97.65 100.28 104.05 110.36 114.57 90.56 94.95 102.85 109.16 110.29
HI 18,373.60 20,638.76 18,618.15 32,559.01 25,545.72 539.52 527.28 559.32 560.69 637.37 87.63 80.06 84.78 94.24 101.77 89.66 94.14 109.66 107.9 91.9
IA 13,147.20 14,324.85 15,021.71 15,116.14 16,623.28 381.37 397.53 403.84 422.73 456.95 106.89 111.54 113.74 118 120.85 73.09 75.84 81.47 88 88.46
ID 16,953.81 18,565.74 19,259.38 20,388.83 21,835.34 463.17 501.98 504.57 508.96 526.99 125.1 125.8 129.38 132.34 134.38 85.27 88.4 95.7 107.04 104.5
IL 16,240.67 17,069.28 17,312.40 17,634.44 18,470.22 447.33 467.29 460.95 446.93 447.15 103.25 105.22 107.46 111.74 115.34 87.42 93.68 103.11 109.32 111.5
IN 19,339.21 20,664.45 21,293.61 21,683.81 23,405.69 555.21 572.94 586.53 605.52 610.35 99.22 102.24 105.79 111.99 117.62 78.52 84.15 88.61 95.52 96.69
KS 15,237.92 15,065.86 15,731.48 16,310.24 17,261.83 466.98 477.91 480.58 477.62 498.89 95.95 97.42 99.11 98.75 101.76 81.45 85.2 91.62 96.59 98.9
KY 14,646.74 15,633.02 15,363.01 16,512.22 16,623.89 500.06 539.6 493.56 488.44 511.33 79.24 80.99 88.6 93.52 98.63 74.8 80.3 85.78 90.62 93.7
LA 14,025.16 14,577.48 14,791.49 15,219.48 16,306.23 361.34 364.13 354.87 348.98 369.71 96.6 99.17 103.7 108.64 110.37 82.34 87.32 96.16 97 97.1
MA 14,643.16 15,868.33 16,083.55 16,321.31 17,514.18 255.68 270.43 275.95 280.68 290.28 113.94 118.03 123.03 129.45 137.49 83.71 95.02 101.72 111.57 116.24
MD 13,402.95 13,718.46 14,439.37 14,761.70 15,803.54 505.46 528.83 522.57 525.27 551.95 85.74 88.44 90.74 95.91 100.52 92.05 99.39 108.68 113.08 116.54
ME 19,690.95 21,651.54 22,953.96 25,059.05 25,937.33 362.27 395.58 419.7 437.64 473.98 106.55 110.18 113.73 117.09 122.74 77.86 85.2 92.23 100.31 100.95
MI 15,537.36 15,971.32 16,669.98 16,426.95 17,205.09 378.91 388.28 399.6 417.04 433.96 91.94 94.37 99.79 102.89 107.53 79.8 85.18 92.21 98.34 100.34
MN 16,206.54 17,764.22 17,923.36 19,217.63 20,650.79 459.38 493.4 534.63 567.18 579.56 128.97 133.53 137.58 143.52 149.68 80.81 85.64 88.88 96.37 103.67
MO 13,296.87 14,817.76 15,354.25 16,676.67 16,752.89 357.98 372.7 406.63 404.06 432.1 93.32 96.23 99.03 102.85 105.19 81.4 86.25 92.73 99.13 104.08
MS 13,555.23 14,226.21 13,911.80 14,869.19 15,567.06 441.99 463.11 478.91 483.37 528.08 93.86 94.95 96.44 102.23 104.49 81.22 88.08 89.56 96.16 95.14
MT 19,196.40 18,116.93 22,752.93 22,605.30 20,881.81 456.71 487.73 455.7 454.55 489 134.46 140.07 146.04 146.14 150.03 78.56 85.79 85.25 96.09 93.73
NC 16,624.83 17,213.67 17,874.64 18,232.06 18,146.54 617.26 661.07 675.34 686.85 674.57 97.03 101.16 105.06 110.16 112.5 86.89 90.28 99.53 105.39 107.83
ND 16,217.38 16,632.17 15,947.47 21,385.48 18,209.48 498.05 501.76 563.49 567.31 606.86 125.29 126.81 129.73 138.57 149.28 66.41 69.44 82.97 94.93 97.99
NE 16,063.98 16,671.29 17,548.52 18,176.55 19,613.33 481.54 494.38 504.63 527.74 543.27 106.57 110.49 111.09 111.33 118.72 82.5 87.58 95.57 102.06 100.24
NH 18,493.43 20,125.19 20,799.95 22,460.02 23,050.47 374.19 390.74 401.29 406.98 431.89 132.27 137.44 143.23 153.88 158.93 88.99 94.47 100.38 110.8 113.71
NJ 16,581.95 17,869.63 18,872.45 20,339.46 21,047.91 528.28 532.44 535.2 540.39 570.77 99.57 102.84 106.21 109.32 112.96 113.16 123.58 135.73 140.14 142.58
NM 16,464.69 16,864.53 17,663.26 21,606.93 19,582.68 457.99 497.28 502.99 511.71 460.16 107.85 109.22 113.07 122.13 128.58 77.58 81.91 94.24 102.28 100.97
NV 15,851.71 18,314.09 18,975.94 19,234.93 19,280.72 667.84 756.22 772.67 780.69 831.45 94.38 96.34 99.65 105.88 109.69 88.26 95.15 106.98 112.62 114.76
NY 16,816.23 18,491.09 20,086.75 21,559.39 23,626.52 327.32 341.86 358.96 379.68 424.08 100.33 102.15 105.88 109.73 112.46 109.92 121.39 134.25 139.92 146.17
OH 16,254.70 17,159.54 18,972.70 19,661.49 20,400.51 374.61 403.19 412.96 426.06 454.66 94.93 97.14 101.44 109.25 114.35 82.61 87 93.91 99.99 102.98
OK 14,918.45 15,235.60 15,464.19 17,692.77 18,484.44 515.93 535.93 541.55 547.68 569.91 87.96 87.48 90.88 97.72 98.52 83.77 87.69 94.27 101.1 100.07
OR 19,290.51 20,985.82 20,780.72 21,711.66 23,143.93 403.95 414.44 422.01 429.83 476.62 124.92 127.01 130.28 134.83 137.17 78.67 84.48 94.77 101.88 105.21
PA 16,391.48 17,685.91 17,617.06 18,358.58 19,209.29 364.71 384.3 392.4 405.3 442.42 96.86 100.9 102 108.64 111.16 88.35 96.69 107.29 112.89 115.36
RI 16,437.85 16,637.23 16,642.52 18,194.35 18,321.84 225.91 236.37 242.79 241.94 245.46 90.79 94.5 97.83 106.17 111.38 81.23 86.2 92.29 99.18 101.14
SC 20,960.00 21,927.58 21,958.32 22,639.70 24,511.86 633.18 682.97 712.9 726.3 755.82 97.39 100.19 104.7 110.42 111.94 82.59 87.2 94.39 99.42 103.21
SD 19,169.67 19,033.45 22,857.72 24,504.71 26,427.02 759.02 811.61 848.91 892.4 901.72 128.65 130.28 133.26 134.02 142.48 76.92 74.69 79.91 88.12 100.38
TN 14,424.44 15,327.48 16,303.30 16,571.26 16,989.40 479.07 496.14 512.41 526.83 560.22 84.59 88 92.27 96.88 99.32 79.25 84.58 90.03 95.55 97.94
TX 17,728.30 18,227.91 19,122.97 20,158.58 20,739.80 621.79 636.43 650.24 654.37 686.9 97.21 99.81 104.26 109.88 111.1 95.48 106.56 114.83 118.24 114.14
US 17,272.41 18,257.71 19,092.44 20,067.02 20,942.52 472.51 497.09 510.86 522.4 548.52 99.45 102.45 106.09 111.41 115.42 86.94 93.38 101.73 107.23 108.68
UT 12,606.55 14,511.45 15,037.71 16,025.00 16,027.28 494.65 543.45 568.84 562.68 575.38 92.8 95.1 97.56 104.92 110.07 84.11 87.29 91.96 98.79 100.43
VA 16,712.10 17,285.57 18,649.21 18,886.24 20,208.52 554.56 574.03 585.86 588.75 618.86 92.64 96.36 99.47 103.32 106.2 89.05 94.29 101.39 106.49 108.98
VT 19,759.22 18,940.26 16,812.99 20,703.73 22,420.89 392.07 382.48 411.52 421.73 457.28 156.62 152.69 152.54 169.12 182.39 83.06 89.56 96.09 108.35 99.33
WA 19,498.36 21,687.56 22,031.76 22,276.32 24,244.99 501.64 552.43 562.63 586.65 620.86 104.17 107.75 111.3 114.46 116.37 87.8 94.76 104.45 111.57 118.44
WI 17,262.43 18,827.27 18,714.82 20,167.23 20,758.27 472.6 487.54 506.35 521.43 537.72 155.63 160.47 167.37 176.68 183.81 73.38 77.27 86.23 94.76 99.44
WV 18,513.20 20,317.18 21,043.50 22,408.65 23,944.81 458.83 474.06 476.99 505.77 559.26 98.66 98.75 100.31 108.14 116 74.57 76.84 83.92 90.86 90.83
WY 20,792.48 21,370.45 24,331.18 24,574.78 22,711.73 537.22 578.01 583.77 638.1 628.67 176.64 190.05 198.89 191.26 192.89 79.55 86.81 91.27 103.91 108.29

More state budget cuts coming — will Alaskans be ready?

6

By WIN GRUENING
SENIOR CONTRIBUTOR

Gov. Michael Dunleavy’s quest to balance the state budget reached its first milestone.   On Aug. 19, Dunleavy achieved what very few thought was possible – almost $680 million in hard cuts in finalizing Alaska’s FY 2020 budget.

While this was unprecedented, it only constituted the first step in the primary goal he advocated during his gubernatorial campaign – a sustainable budget.

After all the legislative special sessions, public hearings, and political fights in 2019, it’s hard to imagine going through a contentious budget battle again next year.

However, it appears that we will.  Judging from much of the reaction around the state, not many believe it.

Win Gruening

Alaskans’ debate on the size of the Permanent Fund Dividend has dominated the discussion in the hope that it could, by itself, resolve all of Alaska’s budget issues.  In some ways, though, it was a diversion.  Even with the currently reduced PFD of approximately $1,600, Alaska must deal with a $730 million budget deficit next year.

Granted, final decisions on the current cuts and PFD amount were not determined until recently.

But hoping to forestall the inevitable by mounting a recall effort – or thinking that ratcheting up taxes on the oil industry will save us – is wishful thinking.

Suffering from denial, many school districts and municipalities have been reluctant to take the necessary measures to prepare for the continuing pressure on their budgets.

The mistake some local governmental entities will make is to assume that Alaskans will accept higher property taxes, sales taxes or debt before considering further cuts or less onerous revenue measures.

Let’s face it, we Alaskans have been living beyond our means for many years and our local governments, school districts, and, to a degree, even some non-profits have escaped serious scrutiny of their overhead, adherence to mission, and efficiencies.

As a local taxpayer, wouldn’t you want to make sure unnecessary or wasteful operations or practices were identified, curtailed or eliminated before you agreed to a hike in taxes? Or will you just assume that local programs and services are all operating at peak efficiency?

Before committing to new projects or services, wouldn’t you want to know that funding will be prioritized to meet basic needs of public safety and health and required standards of maintenance of public facilities?

The discussions surrounding these questions need to happen sooner rather than later.

Education will remain the elephant in the room.

K-12 school construction debt reimbursement was reduced by half this year.  Looking ahead, the other half will be on the chopping block along with possible changes to the base student allocation and the confusing formulas used to calculate state funding for school districts.

Before begging for more money from their local assemblies, will school districts agree to consider all options – including consolidating or closing facilities and cutting back on non-essential programs?

At the University of Alaska, the second phase of their 3-year budget reduction plan will kick in next year – further impacting local economies where campuses are located.

The University has no choice but to explore boosting other revenues. Obviously, tuition will need to be reviewed.  But before local communities are asked to help support our university system, what other outside sources of income are available?

By all accounts, university alumni fundraising is lagging – as is private support for their athletic programs. Alumni participation rates and average giving are significantly below that of other public universities.

All non-profits would be wise to take a long, hard look at their operations to verify that their expenses and services are truly directed at their core mission and can be justified in this budget environment.

Grants from the Rasmuson Foundation and other grant providers will be under even greater demand.  The departure from the oil patch of British Petroleum, whose philanthropy has provided millions of dollars in charitable contributions within Alaska each year will strain non-profit budgets even further.  As individuals, we’ll all need to dig deeper to help maintain needed social services.

Alaskans have been rescued in the past by rising oil prices.

But that won’t happen this time.  This time it’s real.  Believe it.

Win Gruening retired as the senior vice president in charge of business banking for Key Bank in 2012. He was born and raised in Juneau and graduated from the U.S. Air Force Academy in 1970. He is active in community affairs as a 30-plus year member of Juneau Downtown Rotary Club and has been involved in various local and statewide organizations.

Breaking: UAF study says government wrong on World Trade Center collapse

121

ALASKA-LED TEAM VINDICATES  911 ‘TRUTHERS’

(Editor’s note: In response to reader comments, the photo illustrating this story was replaced to show Building 7. It’s an image from the ae911truth.org website.)

The leading program in Alaska for engineering at the University of Alaska Fairbanks and an organization called “Architects & Engineers for 9/11 Truth,” have created a partnership in an investigative study of what brought down Building 7 of the World Trade Center on Sept. 11, 2001.

The release of the draft report on Sept. 3 triggered a two-month public comment process.

[Read the report at this UAF link]

The draft report concludes that fire did not cause the collapse of WTC 7 on 9/11, contrary to the conclusions of the several national private engineering firms and the government’s National Institute of Standards and Technology.

The study concludes that the collapse of WTC 7 was instead a “global failure involving the near-simultaneous failure of every column in the building.” According to the study’s authors:

“The UAF research team utilized three approaches for examining the structural response of WTC 7 to the conditions that may have occurred on September 11, 2001. First, we simulated the local structural response to fire loading that may have occurred below Floor 13, where most of the fires in WTC 7 are reported to have occurred. Second, we supplemented our own simulation by examining the collapse initiation hypothesis developed by the National Institute of Standards and Technology (NIST). Third, we simulated a number of scenarios within the overall structural system in order to determine what types of local failures and their locations may have caused the total collapse to occur as observed.”

The study had three objectives:

  • Examining the structural response of WTC 7 to fire loads that may have occurred on Sept. 11, 2001,
  • Ruling out scenarios that could not have caused the observed collapse, and
  • Identifying types of failures and their locations that may have caused the total collapse to occur as observed.

The UAF research team simulated the local structural response to fire loading that may have occurred below Floor 13, where most of the fires in WTC 7 are reported to have occurred.

The team then “supplemented our own simulation by examining the collapse initiation hypothesis developed by the National Institute of Standards and Technology (NIST).”

Then, the team simulated a number of scenarios within the overall structural system in order to determine what types of local failures and their locations may have caused the total collapse to occur as observed.

The research team is currently organizing and uploading all of its data into a format that can be readily downloaded and used. We expect to post the data sometime between Sept. 16-30, 2019.

Architects & Engineers for 9/11 Truth was started by San Francisco architect Richard Gage, who postulates the government has been hiding evidence of a controlled demolition of the third Trade Tower building that collapsed during the 911 attack.

There will be a two-month public comment period from September 3 to November 1, 2019, with the final report to be released later this year.

“During this period, we welcome any and all members of the public to submit constructive comments intended to further the analyses and presentation of findings contained in the report.

Reviewers outside of the University of Alaska Fairbanks and Architects & Engineers for 9/11 Truth will also review the report during this period. Commenters are asked to send their comments in an attached PDF or Word document to [email protected].”

The government study came to different conclusions, explained in this NIST video:


Republican governors take notice of recall

13

Republican Governors Association Executive Director Dave Rexrode released a statement today in response to the recall effort launched against Alaska Governor Michael Dunleavy:

“Since taking office, Governor Dunleavy has served as the People’s Governor, fighting for a better future for all Alaskans and taking on the special interests. Under his leadership unemployment is at its lowest level in years and he continues to work to attract jobs and economic development to the state. The RGA stands behind Governor Dunleavy against this recall effort by partisan special interests seeking to halt Alaska’s tremendous progress.”

Although no group has formed to defend Dunleavy against the recall effort, the statement from the RGA is an indication that the recall effort has gained national attention.

The Alaska Republican Party also issued a statement, but with a sharper edge:

“Republicans respect the election process; elections are how we choose our leaders in America. Gov. Dunleavy is trying grow the economic pie in Alaska by responsibly dealing with the current budget situation. It appears that Democrats are upset because their various special interest groups could lose influence.
“The Alaska Republican Party supports Gov. Dunleavy, who won with 51.44 percent of the vote in a four-way race in November. The recall efforts started in February, when he had only been in office for less than 12 weeks. We find this recall a cynical attempt to undo the expressed will of the people.”

Dunleavy, won with 145,631 votes to Mark Begich’s 125,739 votes, incumbent Bill Walker’s 5,757 votes, and Libertarian Willian Toien’s 5,402 votes.

Alaska Democrats got involved with the recall caper today; many of the marchers from the CIRI Native corporation building were usual-suspect Democrats and experienced protesters, and the Alaska Democratic Party had its boots on the ground at the event, issuing several supportive Facebook posts and photos of the event.

Attorney General issues statement on recall process

23

The Alaska Attorney General has just issued the following statement on the application submitted today by a group seeking to recall Gov. Michael Dunleavy:

“Following the routine practice for recall applications, the Department of Law today received a request from the Division of Elections to conduct a legal review of the recall application for the recall of Governor Michael Dunleavy. The department will focus on whether the recall application includes sufficient grounds for recall under AS 15.45.510. The grounds for recall are (1) lack of fitness, (2) incompetence, (3) neglect of duties, and (4) corruption. The department will complete its review within 60 days,” said Attorney General Kevin Clarkson.

“I see no need to treat this application any differently than other election applications. I am here to provide legal advice and defend and uphold the state and federal constitutions. The Department of Law will advise the Division of Elections in the same manner it would any other recall. And 60 days will give us adequate time to do a thorough legal review and provide our legal recommendation to the director,” Clarkson said.

Several people, including members of the previous administration, started the effort to recall the governor shortly after he submitted his budget in mid-February. They have now delivered over 49,000 signatures to the Division of Elections in a request for a formal petition, which would require more than 78,000 signatures.

Dunleavy do-over group submits 49,000 signatures

10

IRONY: LAST RECALL WAS TURNED DOWN BY WHO?

The election do-over group known as Recall Dunleavy submitted 49,000+ signatures on its application for a petition today — far more than the 28,501 needed to advance to the next step in a gubernatorial recall election.

The group dropped off the boxes of the application and signatures with the Division of Elections on Gambell Street in Anchorage midday on Thursday after staging a “made for the 5 o’clock news hour” rally and procession from the CIRI building one block away. The CIRI Native corporation has taken a leading role in trying to recall the governor.

Now that the anti-Dunleavy side has gone through the first step, the process continues with a review from the Department of Law.

IRONY LIVES HERE

Ironically, the last time a review was made on a recall by the Department of Law, it ruled against the merits of the recall of former Rep. Lindsey Holmes, who had switched parties after the election.

That opinion was written by Libby Bakalar, who was then an Assistant Attorney General and is now one of the most vocal supporters of the Recall Dunleavy group. She expresses herself frequently on Twitter, such as this epic rant:

Bakalar, in a 17-page decision in 2013, wrote:

“The application’s statement of grounds for recall does not satisfy the legal standard for recall required by AS 15.45.510, in that the alleged facts, taken as true, are insufficient to state a claim for lack of fitness—the sole statutory ground for recall stated in the summary. Therefore, the application is not substantially in the form required by AS 15.45.550(1). We recommend the application be denied because Representative Holmes’s conduct in changing political parties is lawful and constitutionally protected.”

[Read the Lindsey Holmes decision, 2013]

The recall group intends to make the case that because Gov. Dunleavy delayed appointing a judge to a seat within a 45-day time limit set in statute, he broke the law by not appointing until the 72nd day. The courts will ultimately decide if Dunleavy’s actions were unlawful or merely deliberative work protected by a strong governor form of government outlined in the Alaska Constitution.

On March 21, Dunleavy issued a press release stating, “Governor Announces Four New Judges, Declines to Fill Vacant Seat Without Additional Information from Judicial Council.” He then conferred with the council and a month later appointed Kristen Stohler to the second vacancy on the Palmer Superior Court. The replacement occurred before there was an actual vacancy on the court, as Judge Vanessa White was retiring at the end of April.

That set of actions is what the recall group considers its strongest case, hoping that judges on the Alaska Supreme Court will take a special interest in sending Gov. Dunleavy a message or helping him find other work.

The recall group is operating with none of the rules that govern campaigning. They don’t reveal the source of their funding, and are not required to by law, even though they are engaged in a campaign to unseat a sitting governor.

[Read: The Wild, Wild West of recall campaigns in Alaska]

The Recall Dunleavy group is asking for a speedy approval of its application and has indicated it will sue the state if it doesn’t get the approval by October. Its legal counsel includes Scott Kendall, the former chief of staff for the disgraced Gov. Bill Walker, who quit his campaign just days before the General Election rather than face the wrath of voters in 2018.

The Department of Law is expected to release a statement about its process by Friday. released this statement on Thursday.

[Read: Republican Governors Association takes note of recall effort]