

NATIVE STUDENTS ARE NOT DRAGGING DOWN ALASKA’S TEST SCORES
The Alaska Policy Forum, a public policy group based in Anchorage, published a series of charts that the group says disproves an “offensive narrative has been circulating that Alaska Native children are to blame for our state’s low reading test scores.”
The narrative the group refers to has been pushed by opinion writer for the Left, Dermot Cole, in some of his recent columns.
“That narrative is not only extremely divisive and offensive – it is untrue,” the policy group wrote on its website.
Across the spectrum of demographics, almost all Alaska students are under-performing their peers in 4th and 8th grade reading scores, according to the U.S. Department of Education’s National Assessment of Educational Progress. It doesn’t matter if they are white or Native, they’re almost all doing worse than ever in 4th-grade reading.
The charts show where Alaska students rank, and note that economic status is more of an indicator for how a child will do.
What the charts show is that nearly all students across demographic categories in Alaska are scoring below national norms. The exceptions are 4th and 8th grade Hispanic students, who scored above average in reading in the 4th and 8th grades, and black students, who scored higher in reading in the 4th grade, but lower than average by the 8th grade. White students who qualify for free or reduced lunch (lower income homes) scored slightly above the U.S. average.
Other than that, Alaska students are scoring dead last in 13 of 20 measurements for the 4th grade.
In 2003, Alaska students as a whole scored 10th from the bottom in 4th-grade reading. By 2017, they were the worst readers in the nation.
In 2003, Alaska low-income students were third from the bottom, but by 2017, they sank to the bottom.
Here’s the kicker: In 2003, students who were not from low-income families were 8th from the bottom in reading, and in 2017, they too were at the bottom of the heap.
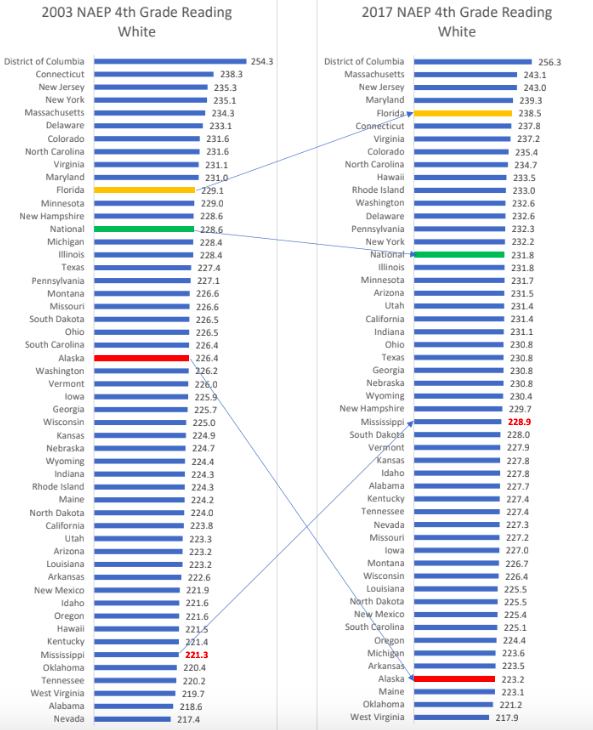
White students in Alaska, which represent the largest number of students, had nothing to write home about in these scores. They were fourth from the bottom of the barrel in 4th-grade reading:
While Native students also dropped, they did not drop by as much as white students. Their comparison is only with states that have enough Native Americans that allow a comparison to be made, thus the smaller comparison:

“Test scores for Native Alaskan children are indeed disappointing relative to other AmericanIndian/Native students in the U.S. But as these bar charts show, early childhood literacy in Alaska is at crisis proportions across the entire economic and ethnic spectrum,” the organization wrote.
The bar charts compare the NAEP reading scores of all 50 states and the District of Columbia between 2003 and the most recent NAEP scores in 2017. Comparisons are made across a wide variety of data slices including economic status, students with disabilities and ethnicity. A 10-point difference in NAEP test scores indicates roughly a one-school-year difference in student achievement, the policy group wrote.
The group has highlighted Alaska in red, the U.S. average in green, Florida in orange, and Mississippi, which in 2017 scored above Alaska on the NEAP for children who qualify for free or reduced lunches.
Alaska students were almost a year behind Mississippi for 4th grade reading.
In all the charts, 2003 scores are on the left side, while 2017 score are on the right. The takeaway is that Native children are not the ones dragging down Alaska’s 4th-grade student performance. There is a greater correlation to socio-economic status in school performance than there is any other measurement.
[Visit the charts at this link.]
